- AppSheet
- Release Notes & Announcements
- Announcements
- Re: Introducing Virtual Column calculation time in...
- Subscribe to RSS Feed
- Mark Topic as New
- Mark Topic as Read
- Float this Topic for Current User
- Bookmark
- Subscribe
- Mute
- Printer Friendly Page
- Mark as New
- Bookmark
- Subscribe
- Mute
- Subscribe to RSS Feed
- Permalink
- Report Inappropriate Content
- Mark as New
- Bookmark
- Subscribe
- Mute
- Subscribe to RSS Feed
- Permalink
- Report Inappropriate Content
Hi everyone,
Virtual columns, though useful, are often based on complex App formulas that can quickly consume resources and impact the overall performance of your app. Until now, there was no way to determine the average computation time required by virtual columns when compared to the total sync time.
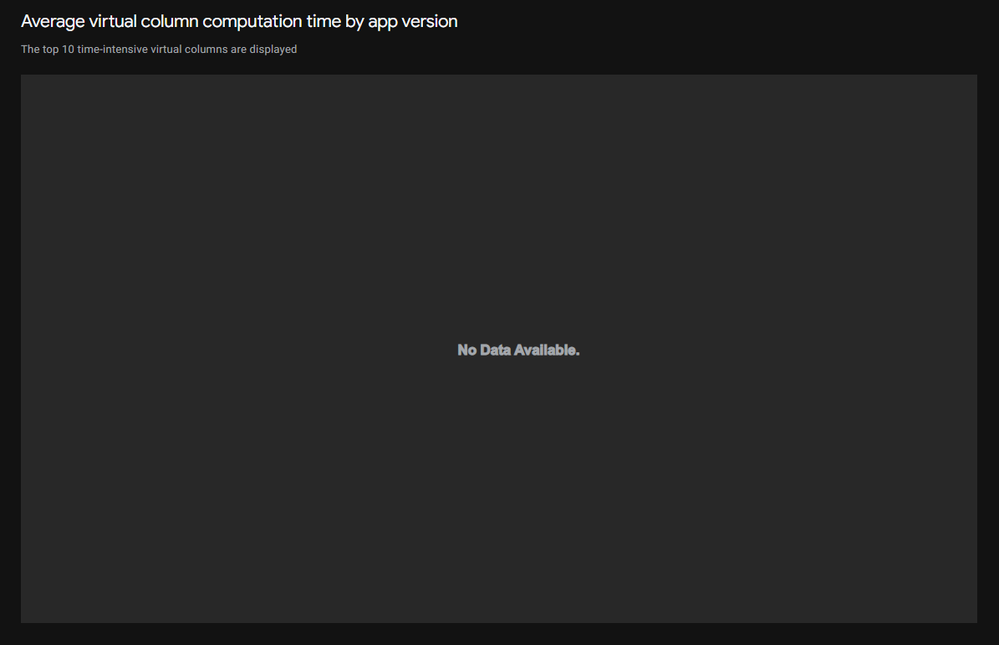
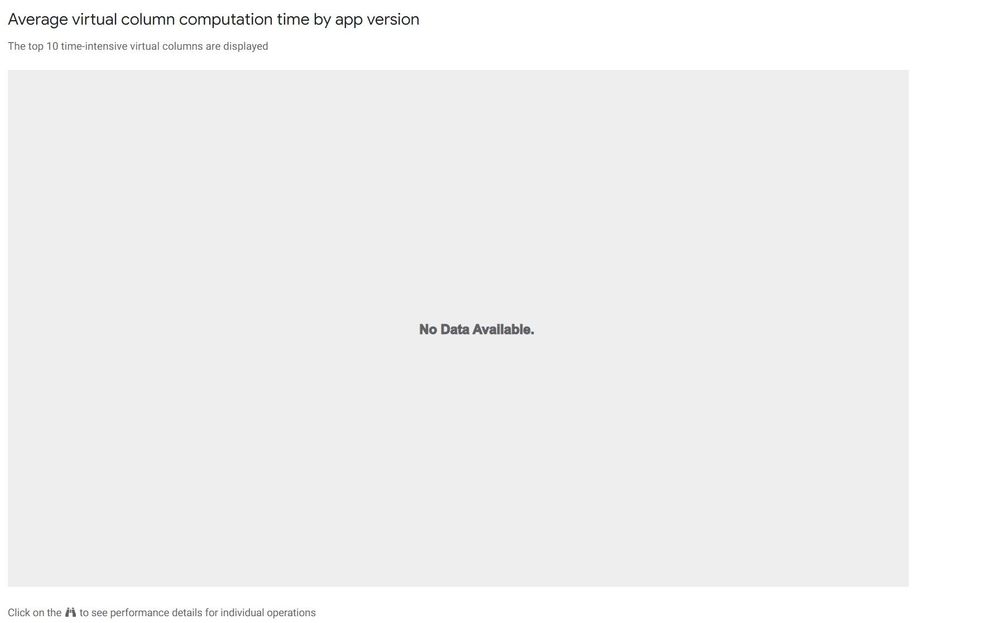
The new Average virtual column computation time by app version graph is now available when you access the Performance Profile by selecting Manage > Performance Analyzer. Use this graph to better understand how the computation time for virtual columns in different app versions is affecting the sync performance, and gain insights to improve app performance.
This feature has been rolled out to all the customers. We would love to hear your feedback.
- Mark as New
- Bookmark
- Subscribe
- Mute
- Subscribe to RSS Feed
- Permalink
- Report Inappropriate Content
- Mark as New
- Bookmark
- Subscribe
- Mute
- Subscribe to RSS Feed
- Permalink
- Report Inappropriate Content
great function, but currently it's not returning any data to me. What am I doing wrong?
- Mark as New
- Bookmark
- Subscribe
- Mute
- Subscribe to RSS Feed
- Permalink
- Report Inappropriate Content
- Mark as New
- Bookmark
- Subscribe
- Mute
- Subscribe to RSS Feed
- Permalink
- Report Inappropriate Content
it seems like a great feature but can someone explain to me why it doesn't work for me?
- Mark as New
- Bookmark
- Subscribe
- Mute
- Subscribe to RSS Feed
- Permalink
- Report Inappropriate Content
- Mark as New
- Bookmark
- Subscribe
- Mute
- Subscribe to RSS Feed
- Permalink
- Report Inappropriate Content
not working 😗🤔🙄😒
- Mark as New
- Bookmark
- Subscribe
- Mute
- Subscribe to RSS Feed
- Permalink
- Report Inappropriate Content
- Mark as New
- Bookmark
- Subscribe
- Mute
- Subscribe to RSS Feed
- Permalink
- Report Inappropriate Content
@Sai1 Could we please have the chart also show the date associated with the version?
- Mark as New
- Bookmark
- Subscribe
- Mute
- Subscribe to RSS Feed
- Permalink
- Report Inappropriate Content
- Mark as New
- Bookmark
- Subscribe
- Mute
- Subscribe to RSS Feed
- Permalink
- Report Inappropriate Content
Last post on here is mine from January, haha, this will probably be like shouting into the void...
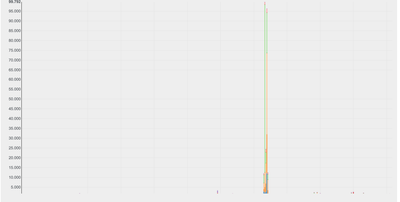
Can we have some way to filter down the versions in the chart? See here:
A couple super high computation time VCs that I only briefly had in the app are making this chart absolutely useless/un-usable.
- Mark as New
- Bookmark
- Subscribe
- Mute
- Subscribe to RSS Feed
- Permalink
- Report Inappropriate Content
- Mark as New
- Bookmark
- Subscribe
- Mute
- Subscribe to RSS Feed
- Permalink
- Report Inappropriate Content
Good idea. Meanwhile, in case it didn't already occur to you, deselect those columns from the legend to filter them out.
- Mark as New
- Bookmark
- Subscribe
- Mute
- Subscribe to RSS Feed
- Permalink
- Report Inappropriate Content
- Mark as New
- Bookmark
- Subscribe
- Mute
- Subscribe to RSS Feed
- Permalink
- Report Inappropriate Content
Oh, I didn't realize that was a feature 😁
- Mark as New
- Bookmark
- Subscribe
- Mute
- Subscribe to RSS Feed
- Permalink
- Report Inappropriate Content
- Mark as New
- Bookmark
- Subscribe
- Mute
- Subscribe to RSS Feed
- Permalink
- Report Inappropriate Content
- Mark as New
- Bookmark
- Subscribe
- Mute
- Subscribe to RSS Feed
- Permalink
- Report Inappropriate Content
- Mark as New
- Bookmark
- Subscribe
- Mute
- Subscribe to RSS Feed
- Permalink
- Report Inappropriate Content
@Marc_Dillon wrote:
this will probably be like shouting into the void...
It's frustrating to see that even minor 'bugs' (not related to new features) have remained unresolved by our support team for far too long...
- Mark as New
- Bookmark
- Subscribe
- Mute
- Subscribe to RSS Feed
- Permalink
- Report Inappropriate Content
- Mark as New
- Bookmark
- Subscribe
- Mute
- Subscribe to RSS Feed
- Permalink
- Report Inappropriate Content
Circus of absurdity 🤣
Imagine a startup (like AppSheet in the beginning) that would handle bug reports in this way. We wouldn't even know the name "AppSheet".
- Mark as New
- Bookmark
- Subscribe
- Mute
- Subscribe to RSS Feed
- Permalink
- Report Inappropriate Content
- Mark as New
- Bookmark
- Subscribe
- Mute
- Subscribe to RSS Feed
- Permalink
- Report Inappropriate Content
@Fabian_Weller wrote:
Circus of absurdity 🤣
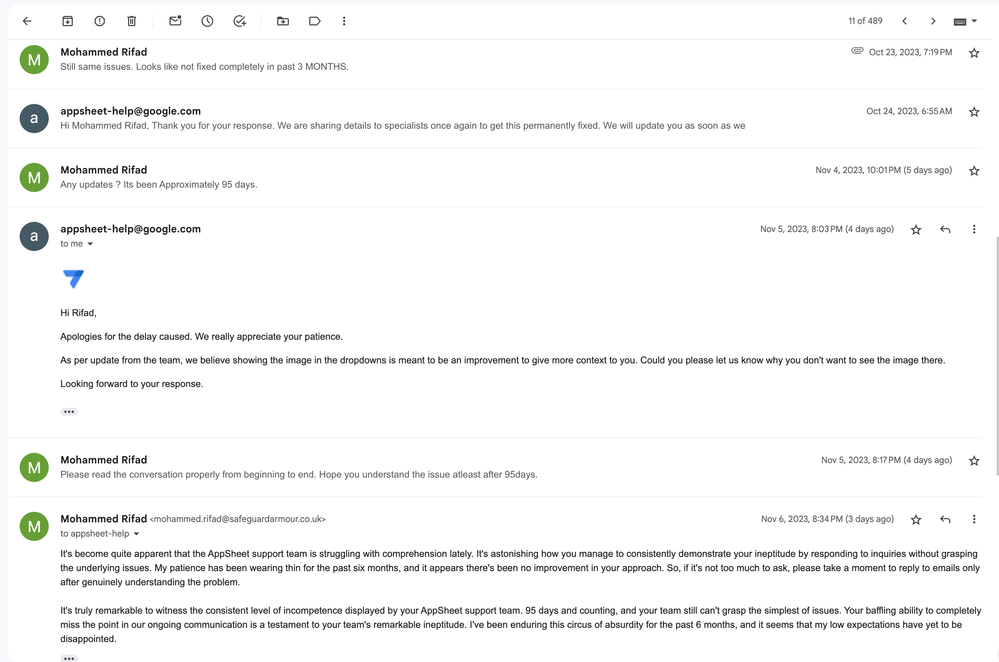
I felt the need to highlight this because what I'm about to show you is a bug that's quite straightforward and obvious. It’s one of those glitches that you see and think, 'Well, that makes sense.' Simple, yet somehow it managed to slip through.
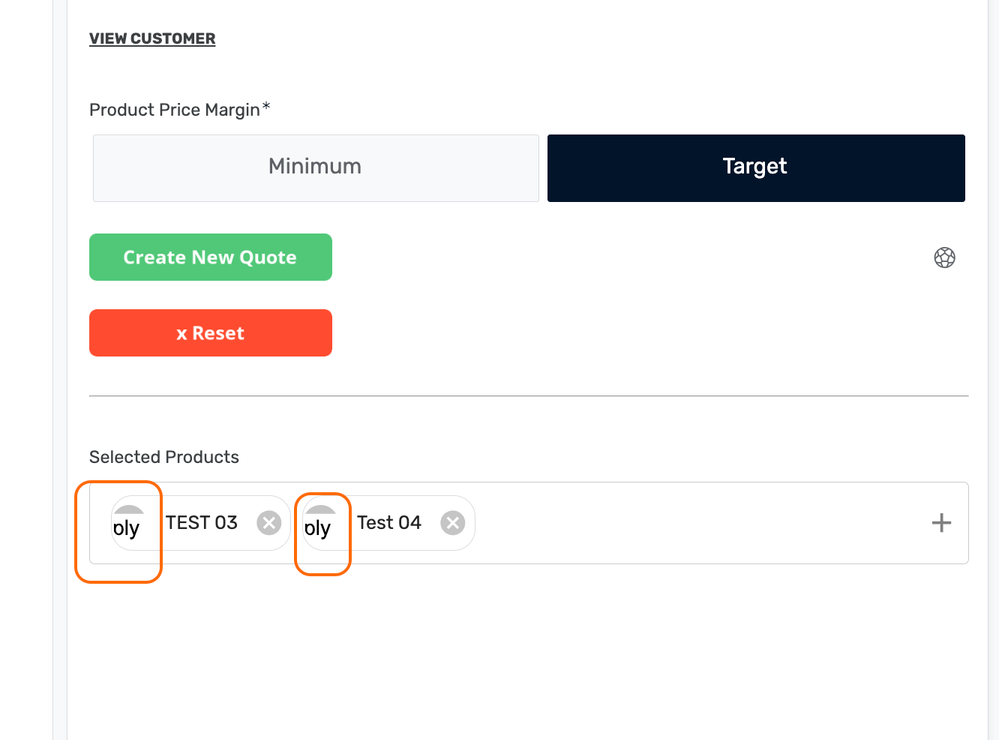
I'm fully aware that the Desktop UI is still in its 'preview' stage, but it seems like some features are more 'preview' than others. For instance, there's a curious absence of a label for the image column in the product table — it's been replaced by what can only be described as a 'random image' placeholder. Quite the innovative bug, if I may say so. I flagged this issue with detailed images and a thorough explanation three months ago.
After a quarter of a year in suspense, I followed up for an update. Their response? Well, it's in perfect harmony with their usual communication style.
- Mark as New
- Bookmark
- Subscribe
- Mute
- Subscribe to RSS Feed
- Permalink
- Report Inappropriate Content
- Mark as New
- Bookmark
- Subscribe
- Mute
- Subscribe to RSS Feed
- Permalink
- Report Inappropriate Content
This graph of virtual columns seems to have disappeared?
- Mark as New
- Bookmark
- Subscribe
- Mute
- Subscribe to RSS Feed
- Permalink
- Report Inappropriate Content
- Mark as New
- Bookmark
- Subscribe
- Mute
- Subscribe to RSS Feed
- Permalink
- Report Inappropriate Content
Obviously a clear bug, but sadly, no response back from Google.
In general, I would say the performance logs seems to be completely broken now. There was occasion where one table took 20 sec to complete to sync. Check the breakdown why it takes such a long sec. There was no clue there to identify the problem as the slowest ops are all less than 0.5 sec....
Furthremore, I noticed the performance log showed the slow operation for one table, bu it s name was not table name but SLICE name..... Slice is nothing to do with the sync performance log.
All in all, and basis my recent experiences, I concluded the performance log is currently broken completely not reliable, not help to debug to find out the slowness. I wish to hope Google to stop to destroy our platform after taking over.... 😪
- Mark as New
- Bookmark
- Subscribe
- Mute
- Subscribe to RSS Feed
- Permalink
- Report Inappropriate Content
- Mark as New
- Bookmark
- Subscribe
- Mute
- Subscribe to RSS Feed
- Permalink
- Report Inappropriate Content
Have faith @Koichi_Tsuji !
The main reason I went to check the performance log today was because I have noticed a HUGE speedup in sync times in the last week or so. Easily twice as fast!
So i wanted to check the logs and compare VC calculations from a few versions ago just to see if it was my imagination. This is why I posted about the VC column performance graphs being missing. I am sure they will return though.
I think Google is making some massive changes to the engine of Appsheet to make everything faster and be able to add needed features. You must appreciate how difficult this must be to do incrementally to a platform while everybody is using it.
Fingers crossed there aren't too many interruptions to your workflow 😀
- Mark as New
- Bookmark
- Subscribe
- Mute
- Subscribe to RSS Feed
- Permalink
- Report Inappropriate Content
- Mark as New
- Bookmark
- Subscribe
- Mute
- Subscribe to RSS Feed
- Permalink
- Report Inappropriate Content
@scott192 wrote:
I think Google is making some massive changes to the engine of Appsheet to make everything faster and be able to add needed features. You must appreciate how difficult this must be to do incrementally to a platform while everybody is using it.
In an ideal business world- getting things done quickly is important. Waiting two years to launch a feature from preview stage just won't be acceptable. If this slow pace continues, the platform could be left in the dust. I had high hopes for everything related to appsheet, but unfortunately, the reality is less than ideal these days to be honest.
- An Appsheet developer since 4 years
- Mark as New
- Bookmark
- Subscribe
- Mute
- Subscribe to RSS Feed
- Permalink
- Report Inappropriate Content
- Mark as New
- Bookmark
- Subscribe
- Mute
- Subscribe to RSS Feed
- Permalink
- Report Inappropriate Content
I feel like I'm missing something very fundamental. I press the Launch Performance Analyzer button. Then I see a long list of events, each with a binocular icon. Clicking on the binocular icon only takes me to the top of the same page. No details are revealed. Tried playing with this many different ways. I swear I saw other data in the past while using this. What am I missing?
- Mark as New
- Bookmark
- Subscribe
- Mute
- Subscribe to RSS Feed
- Permalink
- Report Inappropriate Content
- Mark as New
- Bookmark
- Subscribe
- Mute
- Subscribe to RSS Feed
- Permalink
- Report Inappropriate Content
I am experiencing this same thing with both of the Monitor tools; performance analyzer and audit history. Not sure who to flag down here, but this is definitely a recently introduced bug.
- Mark as New
- Bookmark
- Subscribe
- Mute
- Subscribe to RSS Feed
- Permalink
- Report Inappropriate Content
- Mark as New
- Bookmark
- Subscribe
- Mute
- Subscribe to RSS Feed
- Permalink
- Report Inappropriate Content
Everything seems to be back again. At least on my side.
-
Account
3 -
Announcements
30 -
App Management
8 -
Automation
30 -
Data
31 -
Errors
17 -
Expressions
21 -
Integrations
24 -
Intelligence
5 -
Other
15 -
Resources
15 -
Security
5 -
Templates
13 -
Users
7 -
UX
34

 Twitter
