- AppSheet
- Tips & Resources
- Tips & Tricks
- Create Elegant Looking Prioritized Tasks List -Eis...
- Subscribe to RSS Feed
- Mark Topic as New
- Mark Topic as Read
- Float this Topic for Current User
- Bookmark
- Subscribe
- Mute
- Printer Friendly Page
- Mark as New
- Bookmark
- Subscribe
- Mute
- Subscribe to RSS Feed
- Permalink
- Report Inappropriate Content
- Mark as New
- Bookmark
- Subscribe
- Mute
- Subscribe to RSS Feed
- Permalink
- Report Inappropriate Content
Overview
We have many times tasks management related apps. In any task management app, the task execution priority is crucial.
There are many approaches to prioritize tasks. One prominent approach to prioritize tasks is Eisenhower Matrix. There are many articles available on the internet on this approach if we search by that approach name. Essentially, the Eisenhower Matrix approach recommends classifying tasks into 4 buckets
- Important and Urgent 2. Important and not urgent 3, Urgent but not important 4. Not important and not urgent.
The approach recommends doing these tasks in the above order mentioned.
We can create elegant looking visual representation of the Eisenhower Matrix in AppSheet.
Edit: here is the template app
Note: In the app, please use inline actions in the Tasks summary view within the dashboard to toggle the urgency and importance of tasks.
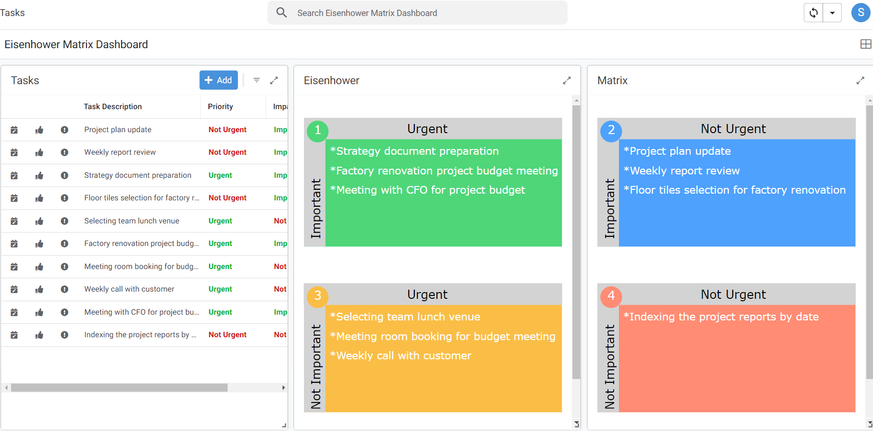
The dashboard created in an AppSheet app for the Eisenhower Matrix looks like below.
A GIF captures shifting of buckets of the tasks when priority or impact of a task is changed.
Implementation
Basically there are only two tables.
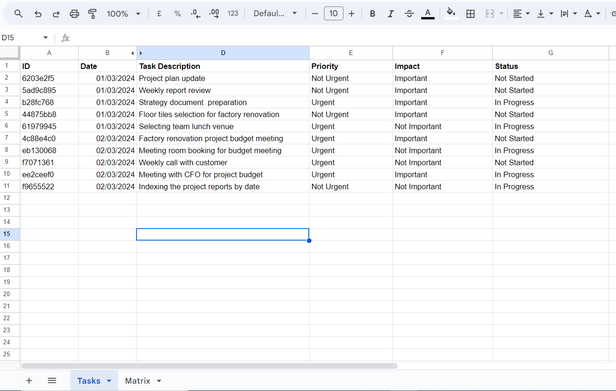
1) The Tasks table lists all the tasks with details- there is one row for each task in the table.
2) The Matrix table has just one row and it displays the tasks in the 4 buckets in a summarized manner. So for each of the 4 quadrants , the Matrix table has one column to list the summarized tasks for that quadrant or bucket.
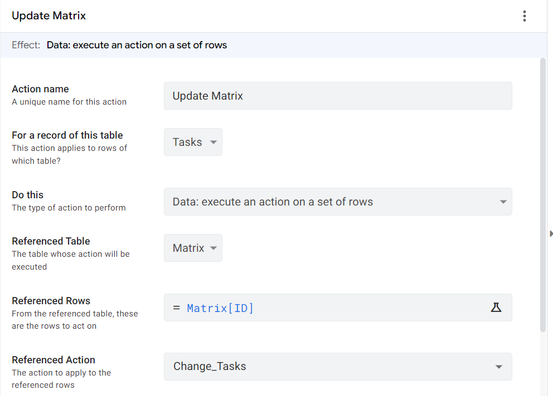
3) A reference action initiated on the Tasks table updates the columns in the Matrix table to store the tasks in summarized manner.
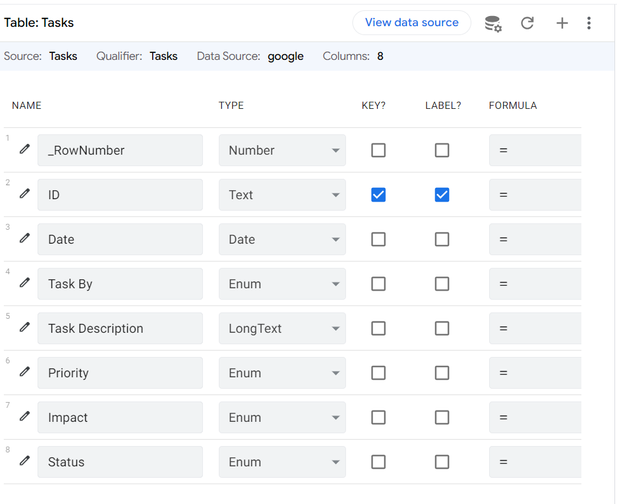
The task table overview
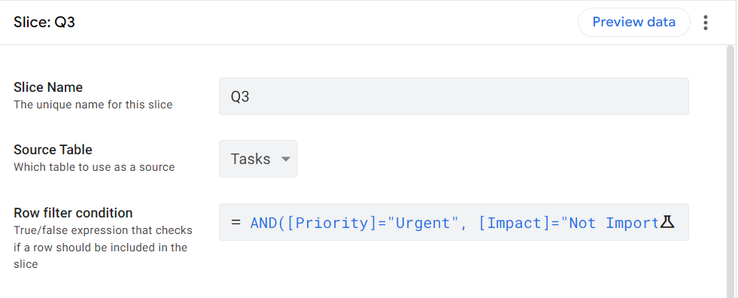
4 Slices on the Tasks table ( One for tasks of each quadrant)
On the Tasks table , there are 4 slices - one each for each task bucket. These slices put the Tasks table records into respective task buckets or quadrants.
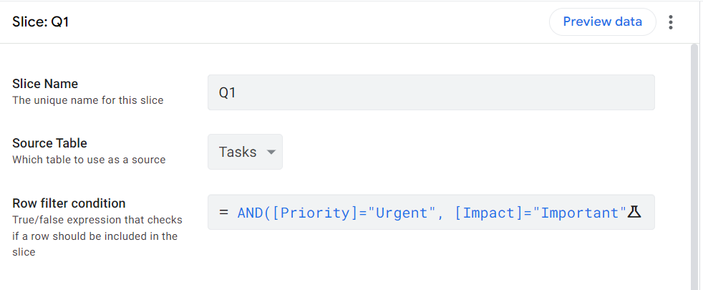
So for example for "Urgent" and "Important" task bucket or quadrant which is 1st quadrant, the respective slice filter expression is
AND([Priority]="Urgent", [Impact]="Important", OR([Status]="In Progress",[Status]="Not Started"))
The slice is called Q1
For the slice of quadrant 3 that corresponds to "Urgent" but "Not Important" tasks, the slice filter expression is
AND([Priority]="Urgent", [Impact]="Not Important", OR([Status]="In Progress",[Status]="Not Started"))
The slice is called Q3
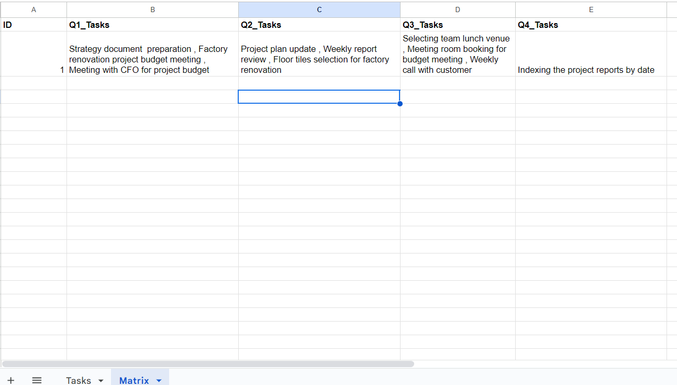
Matrix Table.
There is a single row matrix table that is used to display the tasks visually in the 4 quadrants. In multi user environment, there will need to be one row for each user to store her/ his task priorities.
The matrix table row looks like below
Event Action to Save the Tasks as per Priority and Impact in the Matrix table
There is a form save event action on the Tasks table that runs a reference action whenever a task is added or modified. I found that event action does not run in the desktop mode on form edit. So I have added an inline action to run the reference action.
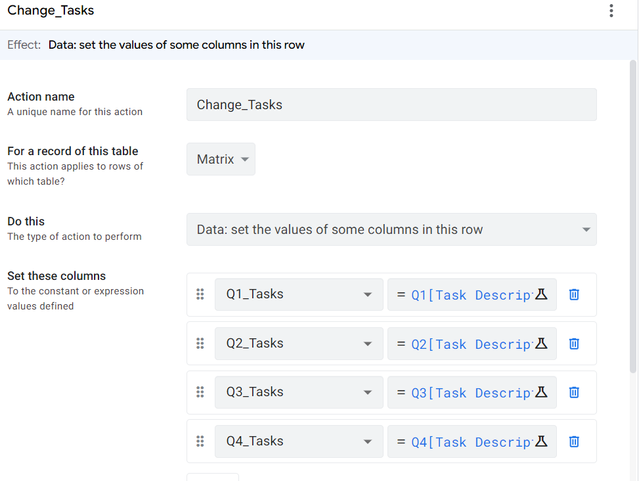
The Matrix table has 4 columns , one each for tasks of respective quadrants. So for example , the reference event action modifies the [Q1_Tasks} column in the Matrix table with an expression
Q1[Task Description] which is a list of all the tasks from the slice Q1 on the Tasks table.
So the reference action updates all the 4 columns ( one each for the 4 quadrants) of the Matrix table with list of respective quadrant slices from the Tasks table.
The reference action initiated on the Tasks table and the associated data change action on the Matrix table looks like below
Display the tasks in Show type virtual columns with SVG code
Finally the list from each of the columns in the Matrix table is shown in a virtual show type column with Image as category type , having an SVG expression as below. The example shows the list of tasks of the [Q1_Tasks] column of the Matrix table being presented in show column.
CONCATENATE("data:image/svg+xml;utf8,<svg version=""1.1""
xmlns=""http://www.w3.org/2000/svg"" xmlns:xlink=""http://www.w3.org/1999/xlink""
width=""500"" height=""250"">
<rect width=""500px"" height=""250px"" fill=""rgb(78, 214, 121)""/>
<rect width=""500px"" height=""42px"" fill=""rgb(211, 211, 211)""/>
<rect width=""42px"" height=""250px"" fill=""rgb(211, 211, 211)""/>
<circle cx=""27px"" cy=""27px"" r=""21px"" fill=""rgb(78, 214, 121)"" />
<text font-family=""Verdana"" font-size=""23px"" text-anchor=""left"" fill=""white"" x=""4%"" y=""13%"">","1"," </text>
<text font-family=""Verdana"" font-size=""23px"" text-anchor=""left"" fill=""Black"" x=""40%"" y=""12%"">","Urgent"," </text>
<text font-family=""Verdana"" font-size=""23px"" text-anchor=""left"" fill=""Black"" x=""-27%"" y=""-27%"" transform=""translate(100,100) rotate(-90)"">","Important"," </text>
<text font-family=""Verdana"" font-size=""20px"" text-anchor=""left"" fill=""white"" x=""10%"" y=""29%"">",IFS(ISNOTBLANK( INDEX([Q1_Tasks],1) ),CONCATENATE("*",INDEX([Q1_Tasks],1)))," </text>
<text font-family=""Verdana"" font-size=""20px"" text-anchor=""left"" fill=""white"" x=""10%"" y=""44%"">",IFS(ISNOTBLANK( INDEX([Q1_Tasks],2) ),CONCATENATE("*",INDEX([Q1_Tasks],2)))," </text>
<text font-family=""Verdana"" font-size=""20px"" text-anchor=""left"" fill=""white"" x=""10%"" y=""59%"">",IFS(ISNOTBLANK( INDEX([Q1_Tasks],3) ),CONCATENATE("*",INDEX([Q1_Tasks],3)))," </text>
<text font-family=""Verdana"" font-size=""20px"" text-anchor=""left"" fill=""white"" x=""10%"" y=""74%"">",IFS(ISNOTBLANK( INDEX([Q1_Tasks],4) ),CONCATENATE("*",INDEX([Q1_Tasks],4)))," </text>
<text font-family=""Verdana"" font-size=""20px"" text-anchor=""left"" fill=""white"" x=""10%"" y=""89%"">",IFS(ISNOTBLANK( INDEX([Q1_Tasks],5) ),CONCATENATE("*",INDEX([Q1_Tasks],5)))," </text>
</svg>")
There is one show column for each quadrant with a similar SVG code in the Matrix table. So total of 4 show columns.
The Matrix table columns are as follows. The highlighted show type , image category columns basically visually display the 4 quadrants in the dashboard.
- Mark as New
- Bookmark
- Subscribe
- Mute
- Subscribe to RSS Feed
- Permalink
- Report Inappropriate Content
- Mark as New
- Bookmark
- Subscribe
- Mute
- Subscribe to RSS Feed
- Permalink
- Report Inappropriate Content
Dear Suvrutt,
Very Good Job!
Could you please share with us the app template?
Thanks
Saddam
- Mark as New
- Bookmark
- Subscribe
- Mute
- Subscribe to RSS Feed
- Permalink
- Report Inappropriate Content
- Mark as New
- Bookmark
- Subscribe
- Mute
- Subscribe to RSS Feed
- Permalink
- Report Inappropriate Content
Hi @Saddam ,
Thank you for your comment. I do not have a Publisher Pro plan. So I am sorry that I am unable to share the app template.
However that is the reason I have shared the implementation in detail with screenshots of actions, tables which is at the heart of the tip. May I request you to go through. I will be pleased to respond to any query.
- Mark as New
- Bookmark
- Subscribe
- Mute
- Subscribe to RSS Feed
- Permalink
- Report Inappropriate Content
- Mark as New
- Bookmark
- Subscribe
- Mute
- Subscribe to RSS Feed
- Permalink
- Report Inappropriate Content
This is a great implementation!
- Mark as New
- Bookmark
- Subscribe
- Mute
- Subscribe to RSS Feed
- Permalink
- Report Inappropriate Content
- Mark as New
- Bookmark
- Subscribe
- Mute
- Subscribe to RSS Feed
- Permalink
- Report Inappropriate Content
Very nice my friend, thank you!
- Mark as New
- Bookmark
- Subscribe
- Mute
- Subscribe to RSS Feed
- Permalink
- Report Inappropriate Content
- Mark as New
- Bookmark
- Subscribe
- Mute
- Subscribe to RSS Feed
- Permalink
- Report Inappropriate Content
Thank you @Joseph_Seddik , @Ryan_Mortimer and @Saddam and all for your appreciation. Please take a look at the template app.
Point to note: Such apps having dashboard views are better viewed in the desktop mode. Also the template app supports maximum 5 tasks in any of the 4 priority buckets.
I had stopped publishing template apps for a long time due to a glitch I had experienced before. However after some good discussions and some app testing with our community colleagues @Aurelien and @AleksiAlkio about the glitch, I am now ready for publishing the app. A big thank you to them for all their help and also @Kirk_Masden whose tip on publishing template apps is so methodical and handy for carrying out the publishing process efficiently.
How to share your app as a template / sample app v... - Google Cloud Community
- Mark as New
- Bookmark
- Subscribe
- Mute
- Subscribe to RSS Feed
- Permalink
- Report Inappropriate Content
- Mark as New
- Bookmark
- Subscribe
- Mute
- Subscribe to RSS Feed
- Permalink
- Report Inappropriate Content
Thanks so much for the mention, @Suvrutt_Gurjar ! The process of sharing an app as a template is not entirely intuitive and after a few months I tend to forget how to do it. So, even I need to go back to my own tip to follow the steps when I publish a new template version of my app for my students. 😉
-
Account
6 -
App Management
21 -
Automation
187 -
Data
140 -
Errors
19 -
Expressions
206 -
Integrations
104 -
Intelligence
18 -
Other
57 -
Resources
24 -
Security
14 -
Templates
56 -
Users
20 -
UX
219

 Twitter