- AppSheet
- AppSheet Forum
- AppSheet Q&A
- Automation Filter Condition hits limitations
- Subscribe to RSS Feed
- Mark Topic as New
- Mark Topic as Read
- Float this Topic for Current User
- Bookmark
- Subscribe
- Mute
- Printer Friendly Page
- Mark as New
- Bookmark
- Subscribe
- Mute
- Subscribe to RSS Feed
- Permalink
- Report Inappropriate Content
- Mark as New
- Bookmark
- Subscribe
- Mute
- Subscribe to RSS Feed
- Permalink
- Report Inappropriate Content
I have a bot that runs daily to check if there are pending schedule changes to employee tasks.
I have a table of tasks and a child table of pending schedule changes to the tasks.

Today, my team scheduled 151 schedule changes and the bot never triggered. I can’t find any failure reason in the monitoring. From my research, I believe this is due to the internal limitation of the AppSheet automation and it being over the 5 minute run time.
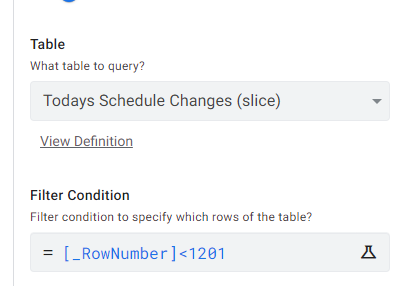
If I manually limit the row number in the filter condition from the table, it will run.
If I try to use Top() formula in the filter condition it does not run.
IN([Key],
TOP(
LIST(Todays Schedule Changes[Key])
,10)
)
I can’t find any diagnostic information for why this isn’t running.
My thought was to take the Top 10 rows from a slice and schedule the bot to run every 20 minutes for a few hours.
I am approaching this problem in the best way?
Thanks!
- Labels:
-
Automation
- Mark as New
- Bookmark
- Subscribe
- Mute
- Subscribe to RSS Feed
- Permalink
- Report Inappropriate Content
- Mark as New
- Bookmark
- Subscribe
- Mute
- Subscribe to RSS Feed
- Permalink
- Report Inappropriate Content
Are you looking in the Monitor page for log entries? It should show if the Bot triggered and failed there.
If it is a run time problem, I would propose two options:
-
151 rows is not that many. Maybe there is a way to reduce the processing needs so it runs faster. First thing to look for is any processing you can do at the time that updates are made during the day. This will spread the load out over time.
-
If feasible, run the process several times during the day. While “Daily” is the smallest frequency. You can create several Daily processes that run at different times but all access the same Process.
- Mark as New
- Bookmark
- Subscribe
- Mute
- Subscribe to RSS Feed
- Permalink
- Report Inappropriate Content
- Mark as New
- Bookmark
- Subscribe
- Mute
- Subscribe to RSS Feed
- Permalink
- Report Inappropriate Content
Thanks for helping John!
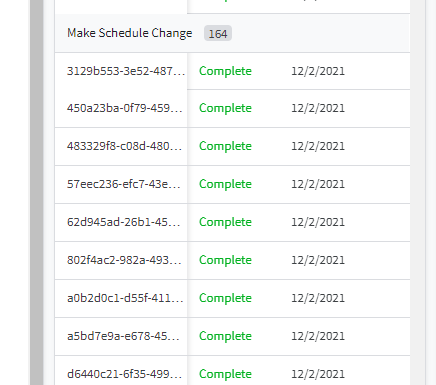
When I look at the monitor log it only shows the green complete for the bots that I ran with the _rownumber<XXXX limit. There isn’t a single error that is listed.
- 151 rows is not that many. Maybe there is a way to reduce the processing needs so it runs faster. First thing to look for is any processing you can do at the time that updates are made during the day. This will spread the load out over time.
I’m currently calling a process that looks up a key from the child table and pushes update.

- If feasible, run the process several times during the day. While “Daily” is the smallest frequency. You can create several Daily processes that run at different times but all access the same Process.
This was my next step, but I can’t get the formula using the TOP() 10 to work in the filter condition.
- Mark as New
- Bookmark
- Subscribe
- Mute
- Subscribe to RSS Feed
- Permalink
- Report Inappropriate Content
- Mark as New
- Bookmark
- Subscribe
- Mute
- Subscribe to RSS Feed
- Permalink
- Report Inappropriate Content
Is your app deployed?
- Mark as New
- Bookmark
- Subscribe
- Mute
- Subscribe to RSS Feed
- Permalink
- Report Inappropriate Content
- Mark as New
- Bookmark
- Subscribe
- Mute
- Subscribe to RSS Feed
- Permalink
- Report Inappropriate Content
It is.
- Mark as New
- Bookmark
- Subscribe
- Mute
- Subscribe to RSS Feed
- Permalink
- Report Inappropriate Content
- Mark as New
- Bookmark
- Subscribe
- Mute
- Subscribe to RSS Feed
- Permalink
- Report Inappropriate Content
I can get the Top() formula to work in a slice view without any issues.
If I use the slice that is incorporating the Top() 10 limit it doesn’t run.
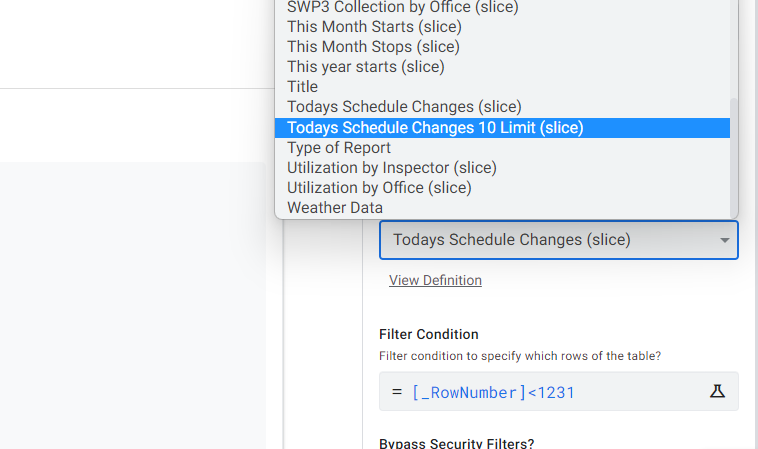
When I use the 10 Limit slice, I set the filter condition to TRUE since the slice removes any unwanted rows.
- Mark as New
- Bookmark
- Subscribe
- Mute
- Subscribe to RSS Feed
- Permalink
- Report Inappropriate Content
- Mark as New
- Bookmark
- Subscribe
- Mute
- Subscribe to RSS Feed
- Permalink
- Report Inappropriate Content
Have you checked the Audit Log? It will have a “Scheduled report rule - …” entry similar to this:
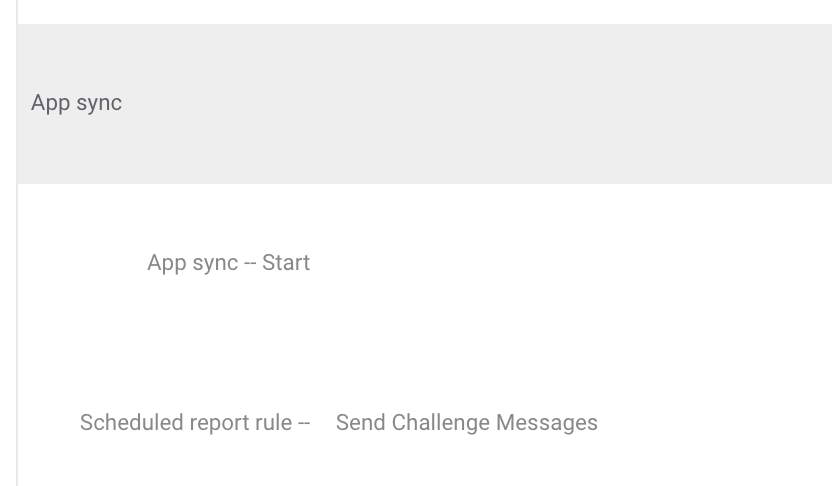
And then show Pass/Fail on the right-hand side like this:

Obviously, You want to search for this entry around the time the Bot should have ran automatically. NOTE: the times are not based on your time-zone. You’ll have to mentally apply the time offset for your zone.
- Mark as New
- Bookmark
- Subscribe
- Mute
- Subscribe to RSS Feed
- Permalink
- Report Inappropriate Content
- Mark as New
- Bookmark
- Subscribe
- Mute
- Subscribe to RSS Feed
- Permalink
- Report Inappropriate Content
I’ve got nothing on the original bot scheduled time. 12:05am my time and 6:05am UTC time.
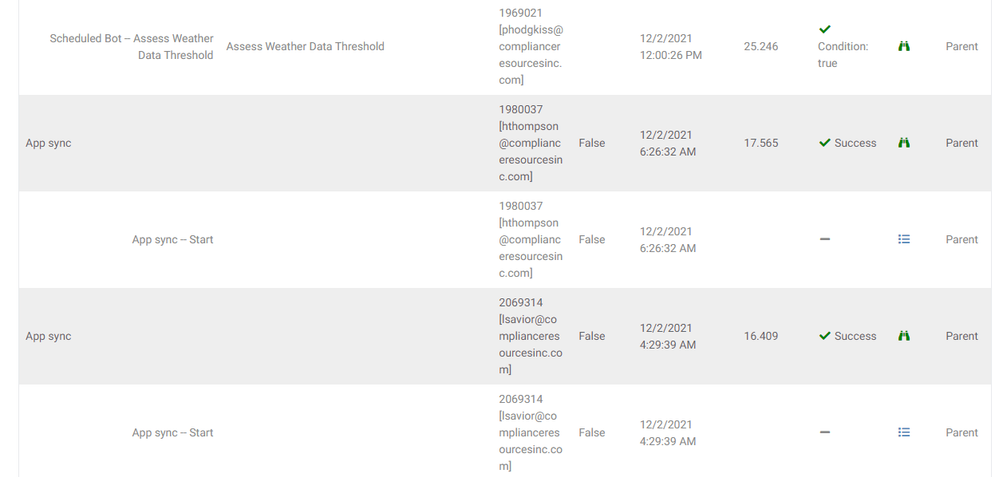
Other scheduled bots triggered at their appropriate times though:
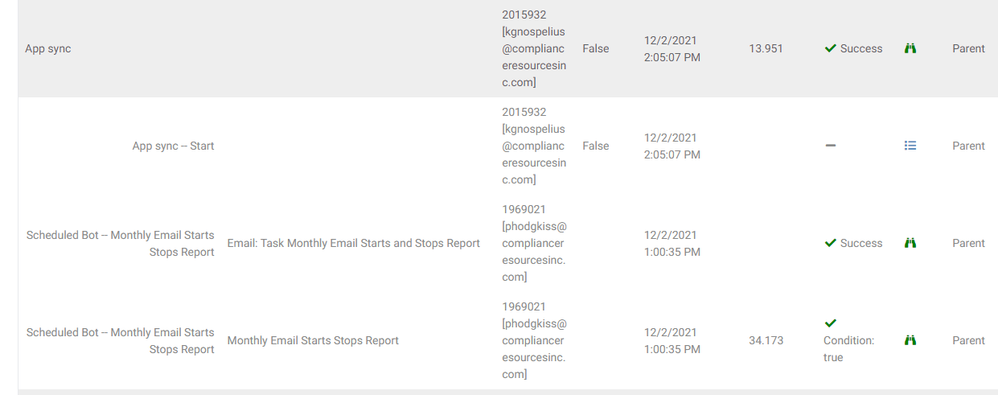
My scheduled bot doesn’t run until I manually trigger it with the filter condition [_rownumber]<XXXX
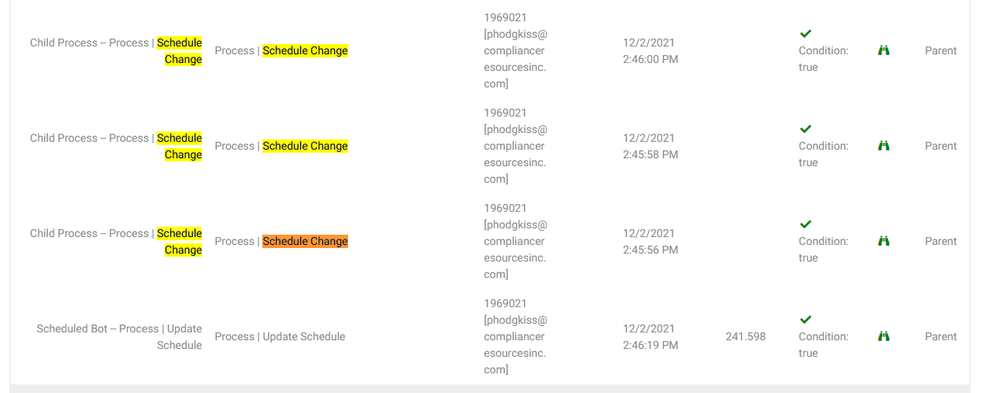
I can’t find a log where it triggers with the TOP() formula.
- Mark as New
- Bookmark
- Subscribe
- Mute
- Subscribe to RSS Feed
- Permalink
- Report Inappropriate Content
- Mark as New
- Bookmark
- Subscribe
- Mute
- Subscribe to RSS Feed
- Permalink
- Report Inappropriate Content
Based on this comment I assumed it was a Bot that WAS working but stopped. So I guess I should ask…Did this Bot successfully automatically run in the past?
- Mark as New
- Bookmark
- Subscribe
- Mute
- Subscribe to RSS Feed
- Permalink
- Report Inappropriate Content
- Mark as New
- Bookmark
- Subscribe
- Mute
- Subscribe to RSS Feed
- Permalink
- Report Inappropriate Content
It was working, but it stops when there are more than 14 tasks queued. I played around with the row filter limit until it consistently ran. This leads me to believe that it is due to the run times.
- Mark as New
- Bookmark
- Subscribe
- Mute
- Subscribe to RSS Feed
- Permalink
- Report Inappropriate Content
- Mark as New
- Bookmark
- Subscribe
- Mute
- Subscribe to RSS Feed
- Permalink
- Report Inappropriate Content
In these two statements, are Tasks = schedule changes?
I don’t know your data structure and what kind of updates are being performed by the Bot but being able to only process 14 or less “tasks queued” seems to be wildly inefficient - if it is indeed a run time problem. I think you may want to take a close look at the process flow to see where the bottlenecks might be.
What bothers me most is that I believe you should be seeing some kind of log entry of the “time out”. At the very least, there should some indication that the Bot attempted to run. The fact that you do not see any indication of that anywhere is a cause for concern. It make me think the Bot isn’t even attempting to run at all…meaning it never has the chance to “time out” in the first place.
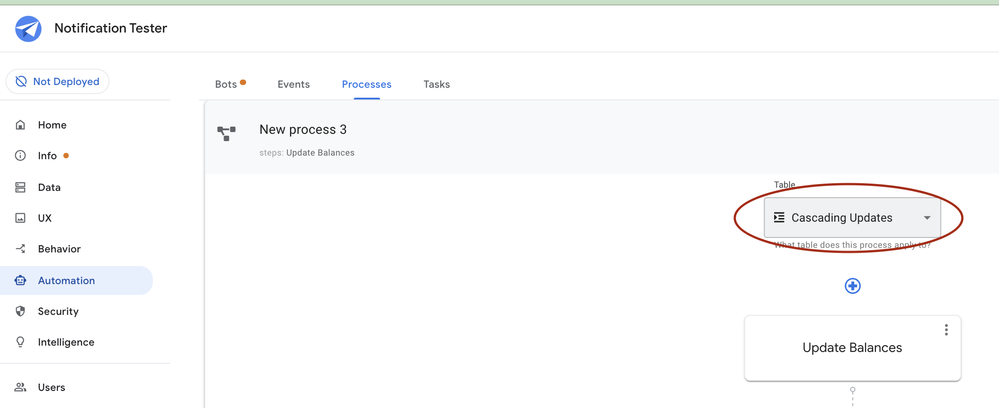
The only time I have heard of this happening is when the datasource does not match between the Event and the Process. To see the table the Process is set for, you would need to open the Process in the Processes tab. Note the table used and make sure it matches with what is set in the Event.
- Mark as New
- Bookmark
- Subscribe
- Mute
- Subscribe to RSS Feed
- Permalink
- Report Inappropriate Content
- Mark as New
- Bookmark
- Subscribe
- Mute
- Subscribe to RSS Feed
- Permalink
- Report Inappropriate Content
Correct Tasks = schedule changes
I removed the text message notification action I was able to process 154 rows with sample data in the production application.
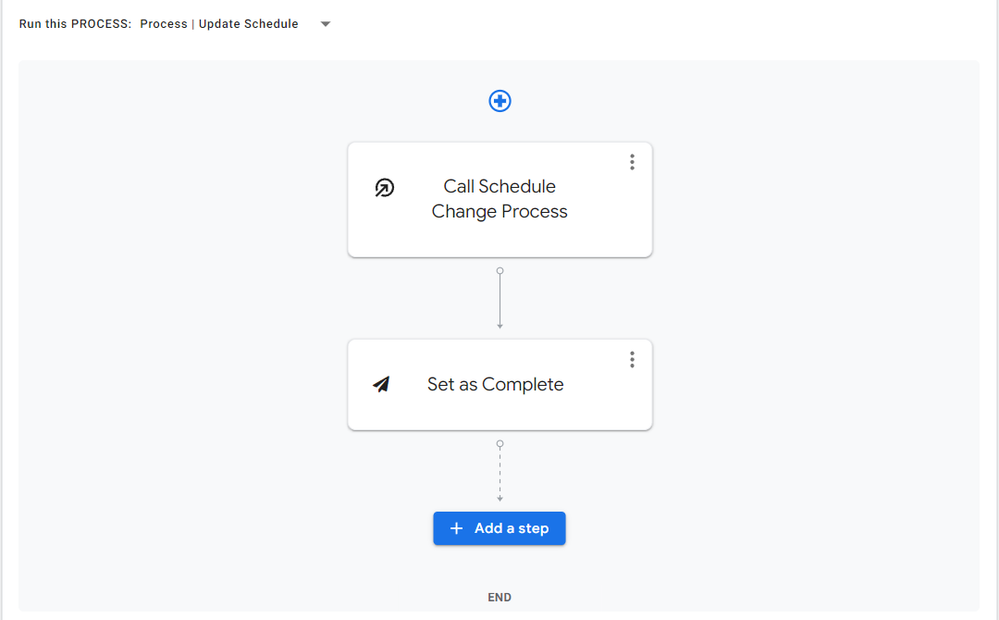
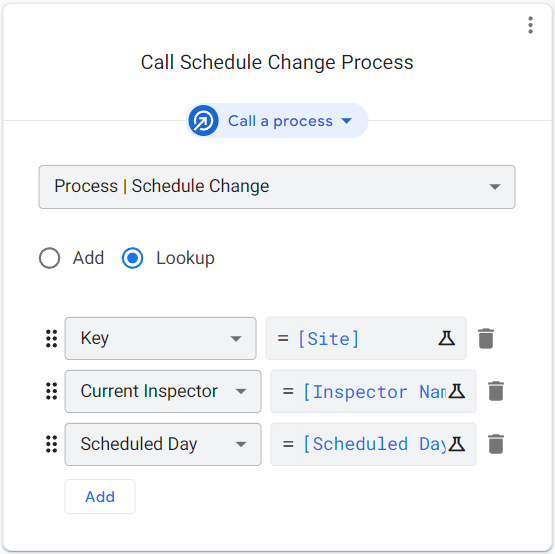
It looks like the “Call a process” is what is taking so long.
Is there a better way to accomplish this?
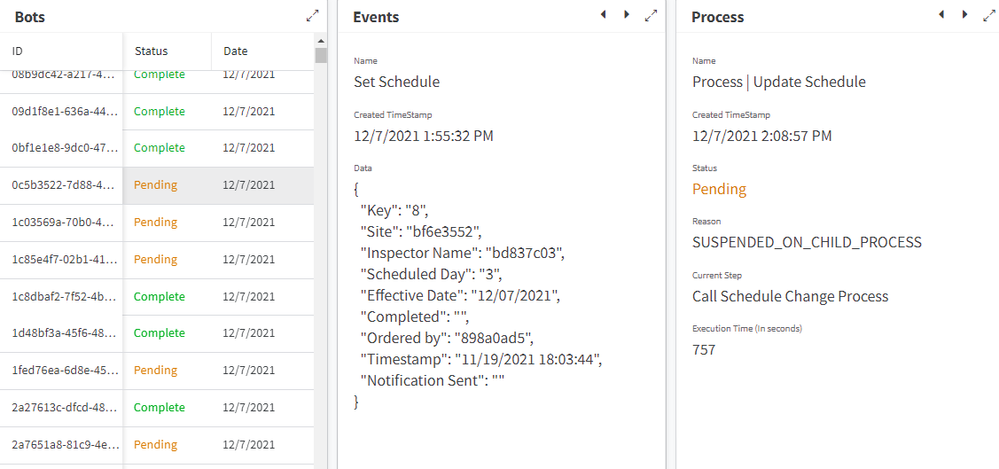
I agree, not being able to see an error code makes it difficult to troubleshoot.
I did verify that that the Event and Processes matched.
Resolution:
I’m going to assume that removing the text message step brought the action under run time limits. It did have some costly lookup functions in it as well.
Thank you so much for your help!
- Mark as New
- Bookmark
- Subscribe
- Mute
- Subscribe to RSS Feed
- Permalink
- Report Inappropriate Content
- Mark as New
- Bookmark
- Subscribe
- Mute
- Subscribe to RSS Feed
- Permalink
- Report Inappropriate Content
One suggestion I can make is to unburden the automation by pre-setting as much of the information as you can in row updates during user activity in the app during the course of the day. Sometimes this might require actions attached to Form saves to update other tables. It may also require some type of summary table that kept updated as add and edits are made. Then your automation only needs to read results rather than stacking a bunch data collection and computation Tasks during the automation.
-
Account
1,676 -
App Management
3,098 -
AppSheet
1 -
Automation
10,320 -
Bug
982 -
Data
9,676 -
Errors
5,732 -
Expressions
11,777 -
General Miscellaneous
1 -
Google Cloud Deploy
1 -
image and text
1 -
Integrations
1,609 -
Intelligence
578 -
Introductions
85 -
Other
2,902 -
Photos
1 -
Resources
537 -
Security
827 -
Templates
1,308 -
Users
1,558 -
UX
9,109
- « Previous
- Next »
| User | Count |
|---|---|
| 39 | |
| 28 | |
| 23 | |
| 23 | |
| 13 |

 Twitter